This is the first of a number of posts mapping racial data and shows Grahamstown’s Black African population using information extracted from the 2011 Census.
The most detailed geographical statistics from the Population Census consist of information for very small areas (the so called small area layer). There are over 50,000 small areas in South Africa, almost 150 for Makana Municipality and 115 cover Grahamstown’s urban area. They range in population size from a few hundred people to approximately 2000.
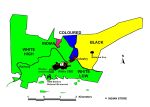
The first map clearly shows that the Black African population (total 53,054) is mostly distributed in the Eastern side of the city. The stars on the map show the centre of gravity (weighted mean centre) for the four population groups. The centre for the Black African population is still located well within the bounds of the township areas that date back to apartheid times and earlier. The old apartheid divisions are shown on the second map. The Black African population has expanded North and South East to new housing developments. Interestingly there is a further expansion South West through the central business district to Rhodes University.