
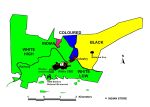
The distribution of the coloured population (total 7615) is the second map in this series showing Grahamstown’s racial distributions in 2011. The main concentration is still immediately to the west of the townships, especially to the northern side of the urban area. This isn’t surprising as the coloured group area was located there: north of the railway station as a buffer between the black population (to the east) and white population (to the west) – the second map shows the former group areas as they were in the mid 1980s.
What is interesting has been the spread of the coloured population south from their apartheid group area down Lavender Valley in the direction of Fort England and also westwards into residential areas formerly reserved for whites . Their centre of gravity has been pulled slightly westwards to just beyond the old group area boundary as a consequence. There are also two concentrations located further west at the military base and Rhodes University. Lastly, there is a small concentration located in the new townships built to the north east of the old coloured group area.


Leave a comment