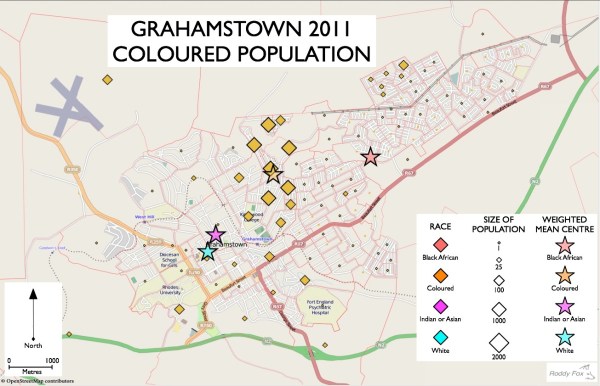
The distribution of the coloured population (total 7615) is the second map in this series showing Grahamstown's racial distributions in 2011. The main concentration is still immediately to the west of the townships, especially to the northern side of the urban area. This isn't surprising as the coloured group area was located there: north of... Continue Reading →
Black African Population map: Grahamstown 2011
This is the first of a number of posts mapping racial data and shows Grahamstown's Black African population using information extracted from the 2011 Census. The most detailed geographical statistics from the Population Census consist of information for very small areas (the so called small area layer). There are over 50,000 small areas in South... Continue Reading →
Population Census 2011: Makana Municipality’s Age-Sex data
There has been a good deal of public discussion about the recently released 2011 population census and it is now possible to start to see some of the local level information. I downloaded the spreadsheet of age-sex information for all of the country's municipalities from the website of Statistics South Africa. Then it was a... Continue Reading →
Grahamstown’s Urban Development: Maps, Photo Pairs, Excursion Guide
I used to have a website devoted to Grahamstown's urban geography before Apple wrote off Mobile Me and support for iWeb. It described how the city grew, showed the segregation and apartheid areas and had pairs of photographs showing how the city has changed. All of those images are now in the gallery below. The... Continue Reading →