One big problem with the energy crisis is visualisation. I keep reading names and figures but until they have a geographical context I can’t really understand the problems. So I’ve put on my Geography Professor Emeritus hat, sourced appropriate data from Eskom and done some GIS work to establish:
Where are the power stations;
How much energy can they potentially produce;
How many of each type are there: coal, gas, renewables etc?
In short – what is the geography of our energy supply?
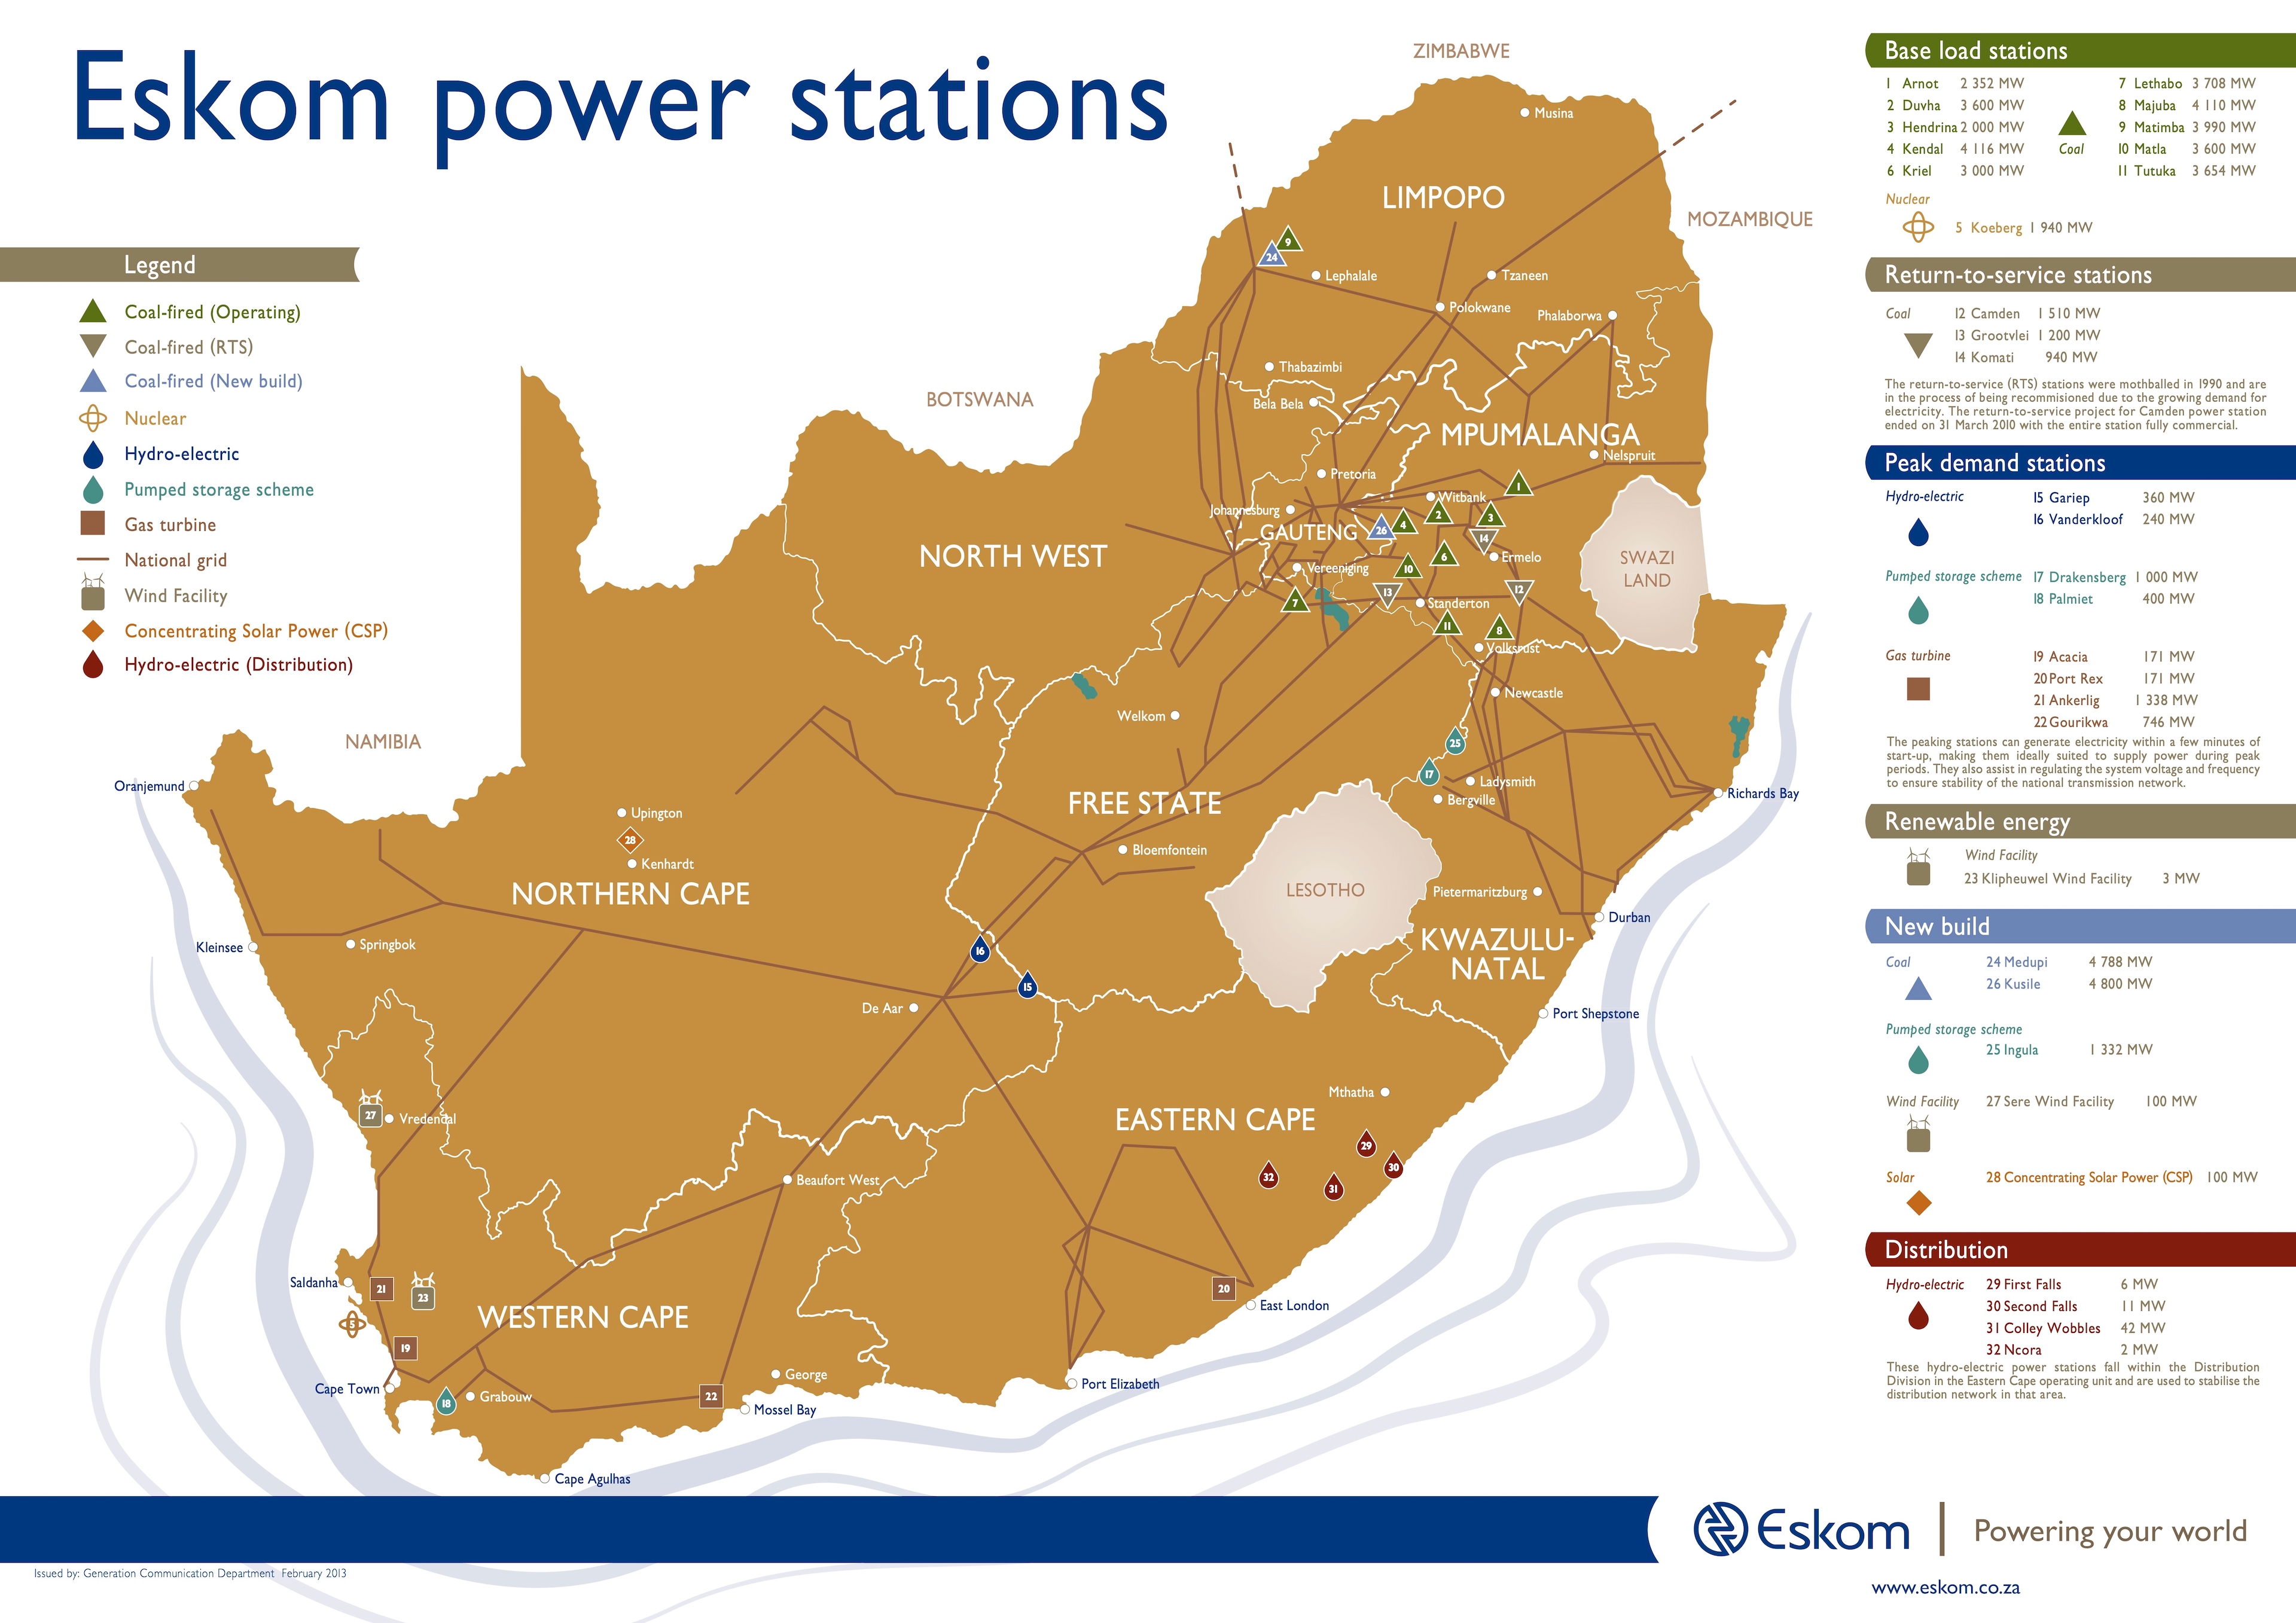
The Eskom Generation Division’s Map of Power Stations is a very useful source of data and, as you can see, it goes some way to answering my questions. But it doesn’t show – as a graduated symbol map would – the amount of energy produced by the different types and it doesn’t include the Renewable Independent Power Producer Programmes (REIPP).
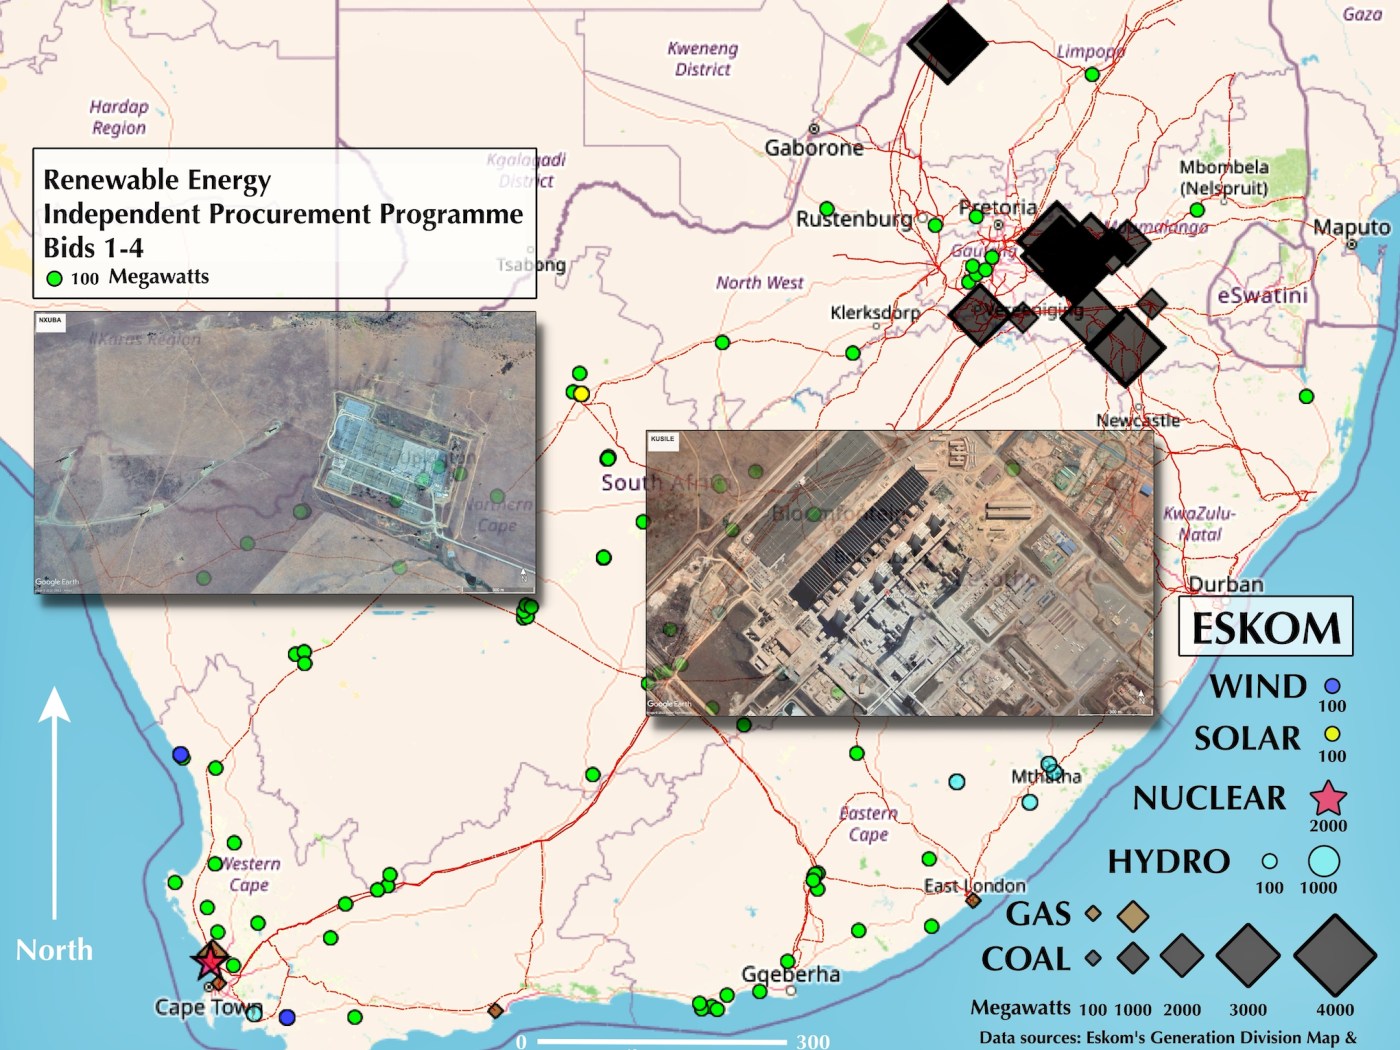
To gain a better picture I accessed the GIS shapefile data from Eskom’s Generation Connection Capacity Assessment 2022 Updated Interactive Map. This gave me the spatial information so that I could map the distribution of REIPP bids 1-4b (the green dots on the map) and also the location of the power transmission lines (in red on the map).
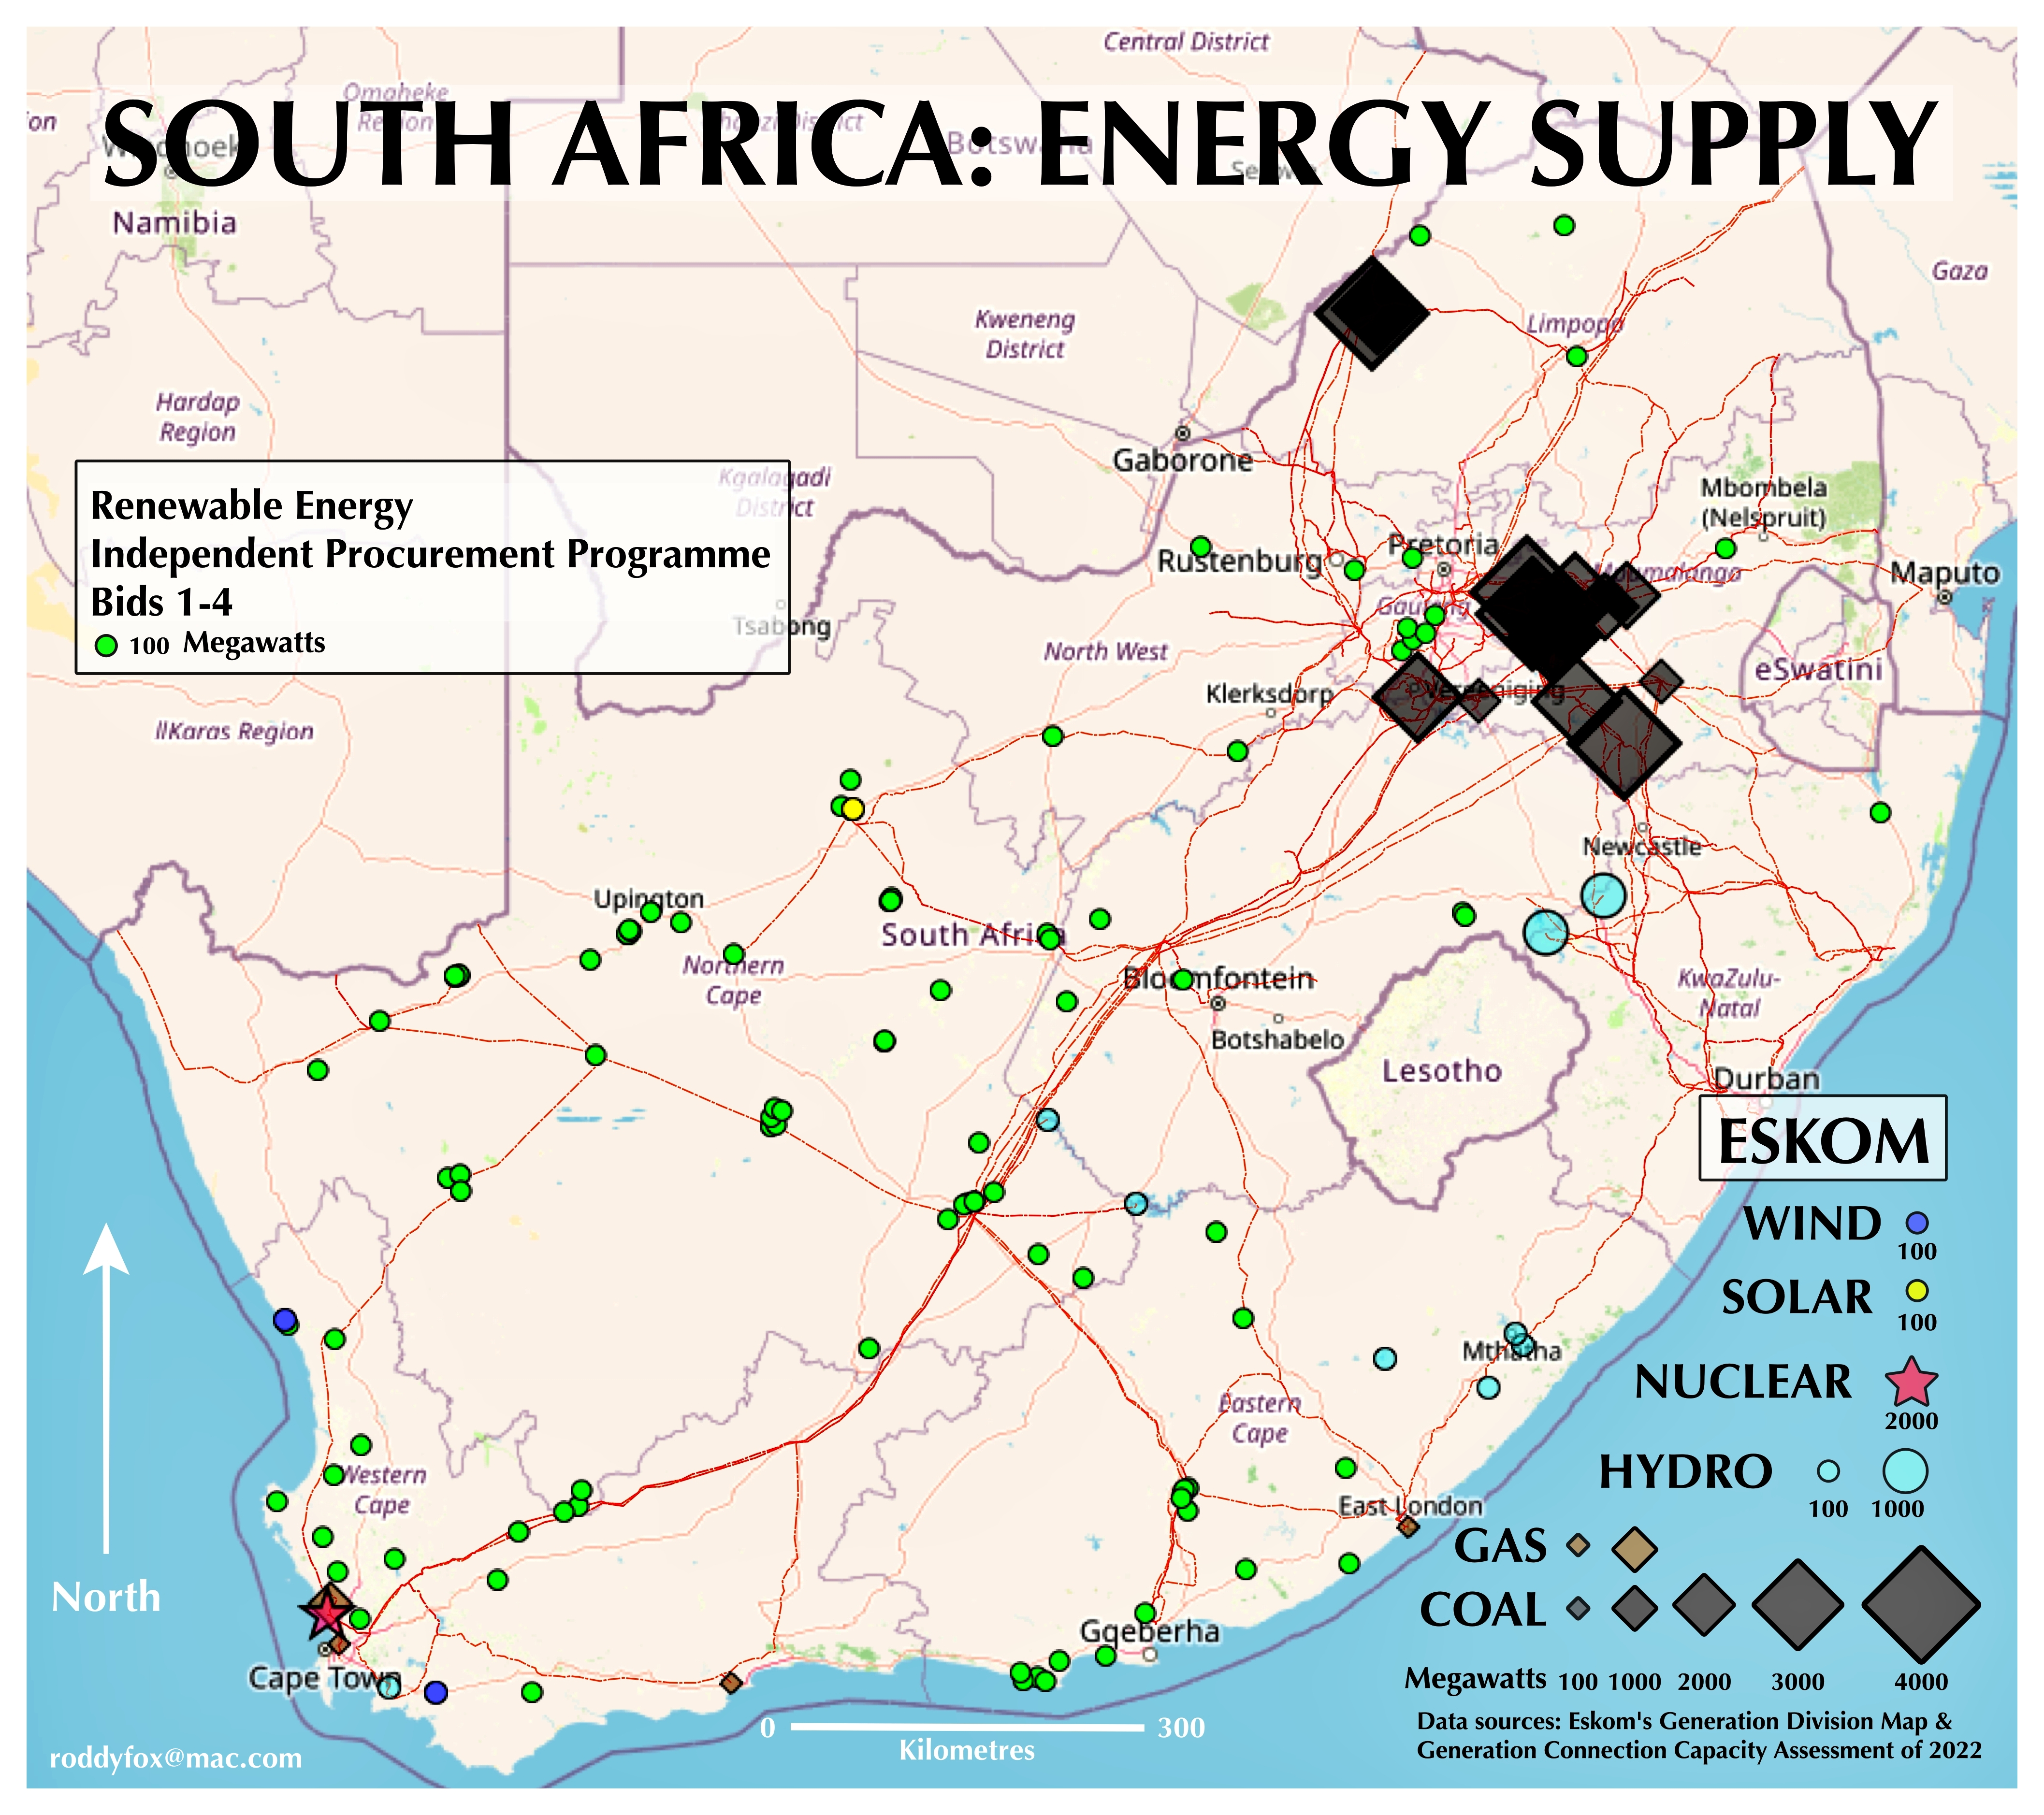
What I can see immediately is the dominance of coal fired power stations: most are on the highveld adjacent to Gauteng with 12 in Mpumalanga and one in the Free State; the remaining two are in the far north on the Limpopo lowveld. To my mind these are South Africa’s old focus of electricity generation. The new geography of energy supply is shown as the rash of small green circles – the 98 renewables under REIPP bids 1-4b. Almost half of them – 48 – are located in the Northern Cape with 17 in the Eastern Cape and 13 in the Western Cape.
To complete the picture we also have:
Eight hydro-electric plants in a semi-circle around Lesotho and one south east of Cape Town: the KwaZulu-Natal Drakensberg has the two with the most power generation;
Four gas turbines all located in coastal areas: East London, Mossel Bay and Cape Town;
One nuclear power station in Cape Town.
This table summarises the distribution – by Province – of the three main sources of power generation. The Northern Cape dominates the REIPP bids, KwaZulu-Natal dominates the hydro-electric and Mpumalanga the coal power stations.
| PROVINCE | REIPP 1-4b Power Stations | REIPP Megawatts | Hydro-electric Power Stations* | Hydro Megawatts | Coal Power Stations | Coal Megawatts |
| Eastern Cape | 17 | 1 469 | 4.5 | 241 | 0 | 0 |
| Free State | 5 | 208 | 1 | 300 | 1 | 3 708 |
| Gauteng | 5 | 23 | 0 | 0 | 0 | 0 |
| KwaZulu-Natal | 1 | 17 | 2 | 2332 | 0 | 0 |
| Limpopo | 3 | 118 | 0 | 0 | 2 | 8 778 |
| Mpumalanga | 1 | 25 | 0 | 0 | 12 | 27 062 |
| Northern Cape | 48 | 2 925 | 0.5 | 120 | 0 | 0 |
| North West | 5 | 7 | 0 | 0 | 0 | 0 |
| Western Cape | 13 | 555 | 1 | 400 | 0 | 0 |
| TOTAL | 98 | 5345 | 9 | 3393 | 15 | 39 548 |
Clearly we have a long way to go before any other source replaces the generation capacity (39 548 Megawatts) of the coal fired power stations. At the moment REIPP bids 1-4b can produce 5345, hydro-electrical 3393, gas turbines 2416, and nuclear 1940 Megawatts.

can you tell me about the background